Introduction to Python - Lesson 5 - Extras
1. Flowchart Diagram
- Flowchart diagram is a visual representation of the flow of data in a program
- It is used to visualize the flow of data in a program
- Software Developers use flowchart to map the flow of data in a program and the way certain actions should be performed.
Usually, flowchart can be modified over the course of the development of the program, when some more functionalities are added, updated, or removed.
We will use
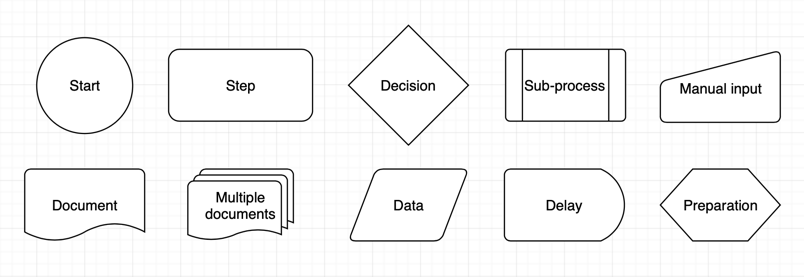
drawio.ioto draw flowchart diagram- Here are some instructions Version 1: How to create flowcharts in draw.io The different shapes used in flowcharts
- Start/End – circles are sometimes used to indicate start and end points.
- Steps – a rectangle or square (often with rounded corners).
- Decisions – usually represented by a diamond.
- A sub-process – a normal step shape with borders on the left and right edges.
- Manual input – where a step requires someone to enter something manually, you can use this step ‘rectangle’ with a sloped ‘roof’.
- Document or multiple documents – where a step results in one or more documents, you can use these shapes
- Data – a parallelogram is used to indicate where information enters or leaves the process. For example, when an invoice is sent to a customer.
- Delay – this is used to show there is a delay before the next step.
Preparation – used to indicate there are setup conditions required for the next step.
- Instruction - Version 2: Draw a basic flow chart in draw.io
Here are many different shapes used to visualise processes in a flow chart.
- Rectangle - Basic steps in your process.
- Diamond (rhombus) - Decisions, usually yes/no questions, that split the process into two or more branches.
- Circle or oval - Optional start and stop points in your process.
- Parallelogram - Input or output, where your process needs or gives information to an external party or system.
- Cylinder - Disk drives, used to indicate that data is stored during that step in the process.
- Rectangle with a wavy bottom line - Documents that are produced as a result of a process step.
1.1. Example Flowchart Diagram
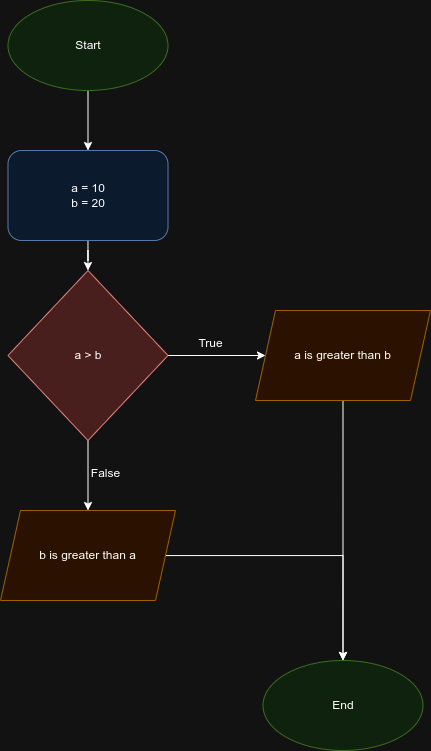
- Let us see a simple Python code:
1
2
3
4
5
6
a = 10
b = 20
if a > b:
    print("a is greater than b")
else:
    print("b is greater than a")
1
b is greater than a
- We can see this flowchart in the image below:
- Here’s an interesting link about using
Draw.ioandVS Code: Flow charts and process diagrams with Draw.io & VS Code
This post is licensed under CC BY 4.0 by the author.


